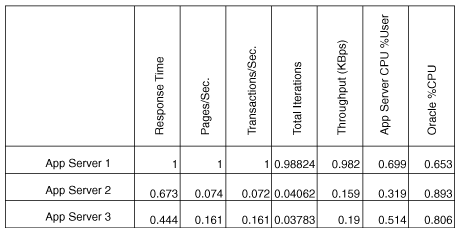
Figure 2: The client and server metrics plotted for a clustered configuration.
Back to Article