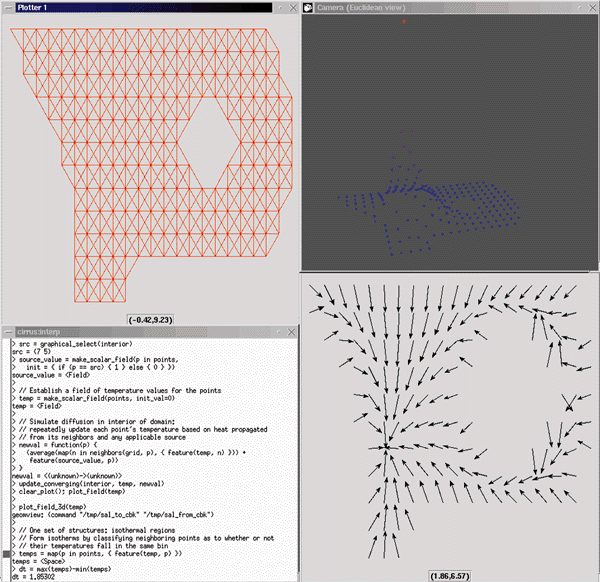
Figure 7: The SAL Interpreter in action, analyzing temperature distribution in a two-dimensional region.
Back to Article