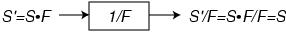
Figure 2: Inverse filtering illustration. Signals are shown in frequency domain.