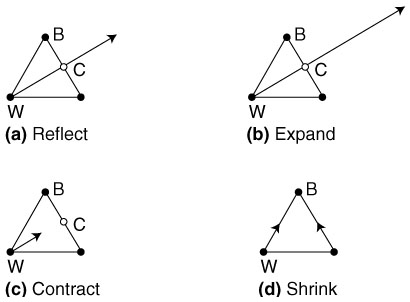
Figure 1:
The initial simplex points are shown as black circles. Point
B
is the best point known; point
W
is the worst. The centroid (
C
) of the simplex without the worst point is shown as an unfilled circle. New points are at the ends of the arrows.