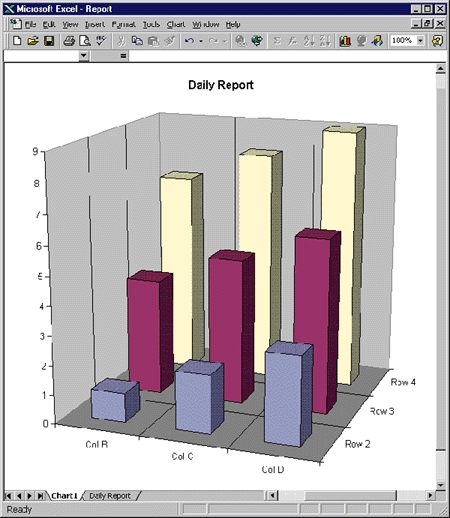
Figure 2: A chart generated by the program in
Listing 1