Dwayne Phillips works as a computer and electronics engineer with the United States Department of Defense. He has a Ph.D. in electrical and computer engineering at Louisiana State University. His interests include computer vision, artificial intelligence, software engineering, and programming languages.
Introduction To The Series Of Articles
This is the fourth in a series of articles on images and image processing. The first article discussed image input and the Tag Image File Format. The second discussed two types of image output — printing and displaying numbers and displaying images as colors and grayscales using EGA and VGA. The third discussed another type of image output — halftoning, or how to display and print images using only black and white. This article will discuss histograms and histogram equalization.Collectively this series has developed the foundation for the C Image Processing System (CIPS). CIPS can read TIFF images, display them (mono, CGA, EGA, VGA), and print them (laser printer, graphics, or character printer). CIPS is almost ready for image processing operators except for one more "preliminary" capability.
This article will explain that capability — histograms and histogram equalization. It will show why histogram equalization is a prerequisite to performing other image processing operations. And it will present source code to implement histogram equalization.
Histograms
A histogram uses a bar graph to profile the occurences of each gray level present in an image. Figure 1 shows a simple histogram. The horizontal axis is the gray-level values. It begins at zero and goes to the number of gray levels (256 in this example). Each vertical bar represents the number of times the corresponding gray level occurred in the image. In Figure 1 the bars "peak" at about 30, 90, 130, and 210, indicating that these gray levels occur most frequently in the image.Among other uses, histograms can indicate whether or not an image was scanned properly. Figure 2 shows a histogram of an image that was scanned poorly. The gray levels are grouped together at the dark end of the histogram. This histogram indicates poor contrast. When produced from a normal image, it indicates improper scanning. The scanned image will look like a TV picture with the brightness and contrast turned down. (Of course, the same histogram could indicate proper scanning for certain unusual images, such as a black bear at night).
Histograms also help select thresholds for object detection (an object being a house, road, or person). Objects in an image tend to have similar gray levels. For example, in an image of a brick house, all the bricks will usually have similar gray levels. All the roof shingles will share similar gray levels but differ from the bricks. In Figure 1, for example, the valleys between the peaks at about 60 and 190 might indicate that the image contains three major kinds of objects — perhaps bricks, roof, and a small patch of sky. Practical object identification is never simply a matter of locating histogram peaks, but histograms have been important to much of the research in object identification.
Photograph 1 shows the boy image from the previous articles with its histogram (in the lower right hand corner). The gray levels in the histogram reach across most of the scale, indicating that this image was scanned with good contrast. Photograph 2 shows the house image from the previous articles with its histogram. Again, the histogram stretches across much of the scale indicating good scanning and contrast.
Because the dark objects and the bright objects in an image with poor contrast have almost the same gray level, the gray shades from such an image will be grouped too closely together (Figure 2) . Frequently the human eye will have difficulty distinguishing objects in such an image. Image-processing operators will have even less success.
Photograph 3 shows an image with poor contrast (a poorly scanned aerial photograph). The rectangles in the center of the picture are house trailers. The areas around the house trailers are roads, parking lots, and lawns. The histogram in the lower right-hand corner shows that the gray levels are grouped in the dark half of the scale. There are trees and bushes in the lawn areas of the image. You cannot see them, however, because their gray levels are too close to the gray levels of the grass.
The cure for low-contrast images is histogram equalization. Equalization causes a histogram with a mountain grouped closely together to "spread out" into a flat or equalized histogram. Spreading or flattening the histogram makes the dark pixels appear darker and the light pixels appear lighter. The key word is "appear." The dark pixels in photograph 3 cannot be any darker. If, however, the pixels that are only slightly lighter become much lighter, then the dark pixels will appear darker. Please note that histogram equalization does not operate on the histogram itself. Rather, histogram equalization uses the results of one histogram to transform the original image into an image that will have an equalized histogram.
The histogram-equalization algorithm may make more sense if we outline the derivation of the underlying mathematical transform. (The full derivation is found in the reference.) Equation 1 represents the equalization operation, where c is an image with a poor histogram. The as yet unknown function f transforms the image c into an image b with a flat histogram.
Equation 1
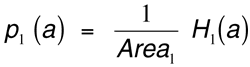
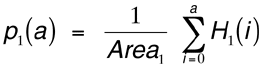
b(x,y) = f[c(x,y)]Equation (2) shows the probability-density function of a pixel value a. p1 (a) is the probability of finding a pixel with the value a in the image. Area1 is the area or number of pixels in the image and H1(a) is the histogram of the image. For example, if
a=100
Area1=10,000
H1(100)=10
then
p1(100) = 10/10,000 = 0.001Equation 2
Equation 3 shows the cumulative-density function (cdf) for the pixel value a. The cdf is the sum of all the probability density functions up to the value a. For example,
P1(10) = 1/10,000 * [H(0) + H(1) + ... + H(10)]Equation 3
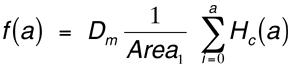
Equation 4 shows the form of the desired histogram equalization function f(a). Hc(a) is the histogram of the original image c (the image with the poor histogram). Dm is the number of gray levels in the new image b. Dm = 1/p(a) for all pixel values a in the image b. Note that the image b has a "flat" histogram
H(0) = H(1) = H(2) = ...because the probability of each pixel value is now equal — they all occur the same number of times. So f(a) simply takes the probability-density function for the values in image b and multiplies this by the cumulative-density function of the values in image c. It is important to realize that histogram equalization reduces the number of gray levels in the image. This seems to be a loss, but it is not.
Equation 4
The algorithm for performing histogram equalization (see Figure 3) is simpler than the equations.
Photograph 4, Photograph 5, and Photograph 6 show the result of histogram equalization. The appearance of some images improves after histogram equalization while it degrades with other images. For Photograph 4 (an equalized verson of Photograph 3) the appearance improves. Note the equalized histogram in the lower right hand corner. Because the target display shows only 16 gray shades, during equalization we reduced the image to 16 gray levels.
The aerial photograph, although fuzzy, has much improved contrast. The dark spots in the lawn areas are trees. If you look closely at Photograph 3 you may be able to see these trees. Photograph 5 shows enlarged details from these two images together with their histograms (CIPS produced these using the print_graphics_image function). The unequalized image on the left of Photograph 5 is dark. In the equalized image on the right of Photograph 5 you can distinguish the trees and bushes from the grass.
With some photographs the equalized image may appear worse than the original image. In a properly scanned image, for example, histogram equalization can introduce "noise" into what were uniform areas of an image. Such "noise" may not be undesireable — in many cases it reflects subtle texture or detail lost in the more "natural" image.
Photograph 6 (segments from the house in Photograph 2) shows how equalization affects a properly scanned image. The histogram for the unequalized image on the right stretches across much of the scale. The bricks, windows, and trees are easy to see. However, in the equalized image on the left, the window and the brick appear too bright. While the equalized image does not appear as pleasant, it does have better contrast. The darks appear darker and the lights appear lighter. In this case, however, they are probably too dark and too light.
Since variations is scanning can siginificantly affect the results of image-processing operators, histogram equalization is a prerequisite for further image processing. If you scan an image too bright or too dark, you can remove objects from an image. The result may "improve" the apparent performance of processing and leading you to overestimate the effectiveness of an operator. Consistently pre-processing images with a histogram-equalization operation will ensure consistency in all results.
The code in Listing 1 simplements the histogram operations. The basic data structure is a 256-element array of unsigned longs. The function zero_histogram zeros or clears the histogram array. The function calculate_histogram creates the histogram for an image array. It loops through the image array, takes the pixel value, and increments that element in the histogram array.
This function and the zeroing function are separate so that CIPS can calculate the histogram of an image that comprises several image arrays. The function perform_histogram_equalization implements the algorithm shown in Figure 3. The first loop over i calculates the sum_of_h array. The loops over ROWS and COLS transforms each pixel in the image to a new value using the number of gray levels in the new image, the area of the image, and the sum_of_h array.
The next functions display histograms to the user. The function show_histogram displays the histogram on the screen using numbers and *s. The function print_histogram prints the histogram to a simple character printer using numbers and *s. Both of these functions scale the histogram so the display will not be wider than the CRT screen or the printed page. The show_histogram function printf's a * to the current line in the last loop over j. The print_histogram function sprintf's a * to a character string. After the function fills the string, it prints it to the line printer. The user calls these two functions from the CIPS main menu.
The display_histogram function works with the display-image functions to display the histogram in the lower right-hand corner of the screen. (We used this facility to create the image plus histogram photographs for this article.) This function first clears an area for the histogram. Next it loops through the histogram array and draws a vertical line the length of the scaled histogram value. Finally, it draws a horizontal axis.
The function print_hist_image (see Listing 2) prints the histogram graphically after the function print_graphics_image prints the image. First the function scales the histogram array. Next the function prints a blank space between the bottom of the image and the top of the histogram. Finally, the function loops through the histogram array. During this loop, it prints a grid mark every 50 elements. For these elements, the left margin is smaller and two extra black marks are printed before the histogram data. The printer must print a fixed number of bytes (200 in this program). The loops print the number of black marks (maximum of 200) and then print the difference between 200 and the number of marks using white spaces.
To integrate the histogram functions into the main CIPS program we added a new option (7) to the main menu (Figure 4) and made straightforward changes to the function display_menu_for_display_image in file display. c.
display image (from Part 2), display_using_halftoning (from Part 3), and print_graphics_image (from Part 3) have been modified in Listing 4, Listing 5, and Listing 6, respectively. The revised listings are available on the code disk for this issue.
Reference
Digital Image Processing, Kenneth R. Castleman, Prentice-Hall, 1979.