Michael Brannigan is president of Information and Graphic System, IGS, 15 Normandy Court, Atlanta, GA 30324 (404) 231-9582. IGS is involved in consulting and writing software in computer graphics, computational mathematics, and data base design. He is presently writing a book on computer graphics algorithms. He is also the author of The C Math Library EMCL.
This article extends the methods discussed in "Fitting Curves To Data" (The C Users Journal, Jan. 1990). That article presented an algorithm which, given a set of data points, produced a piecewise cubic approximation to solve the data fitting problem. However, that algorithm required the user to supply the number and position of the knots. This article describes an algorithm that chooses, adaptively, the number of knots and their position.
Like the earlier algorithm, this adaptive approach will require some linear algebra. However, the adaptive algorithm will also draw upon statistical theory (to analyze errors), information theory (for the adaptation mechanism), and non-linear optimization methods (to compute knot positions).
The Problem
Consider the basic problem. Given data points (xi, yi) i=1,2,...,n we suppose there exists a relation
yi = F(xi) + ei, i=1,2,...,nwhere F(x) is an unknown underlying function and ei represents the unknown errors in the measurements yi. The goal is to find a function f(ak,x) with parameter vector ak, of length k, which is a good approximation to F(x).
The earlier non-adaptive algorithm solved this problem for a fixed value of k (set by the user). Treating k as a variable creates a more complex problem. If we go even further and ask the computer to choose the best value for k and ak, then the algorithm bocomes adaptive.
In curve-fitting applications, the underlying function F(x), often represents some (often disjointed) relationship in the physical world. Splines, or some other piecewise function, have the advantage of matching this disjointed behavior, while retaining global approximation properties. Piecewise functions also exhibit an advantageous flexibility — behavior in one region doesn't significantly effect their behavior in another.
Piecewise functions are also important to the analysis of time-dependent data, or time series analysis, where the periods determine the pieces of the piecewise function.
Piecewise functions depend on certain points called knots. Between each knot we compute some function, usually a cubic polynomial, with parameters depending on the data. For time series the knots occur at the end of the periods, and the piecewise function is a Fourier series.
No matter how you choose the piecewise function f( ), the unknown parameter k depends on these knots, how many knots and where the knots are placed. This article considers the problem of how to automatically find the optimum number of knots and the optimum placement of the knots, that is, to find k.
Statistics
An "optimum" approximation must fit the experimental data with a minimum of error. But whether a given approximation's errors are minimum, compared to a competing approximation's, depends on how we measure the error and what assumptions we make about how "minimum" errors are distributed. In every fitting operation, there are potentially two independent sources of error: poor matching between the approximating function and the real-world phenomenon, and measurement errors in the experimental data. Analytically it is convenient to contribute all errors to the experimental data.If we assume the errors in the data are uniformly distributed, with distribution function:
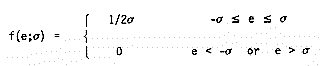
then we need only find the value of the parameter s. Given the n errors ei,i=1,2,...,n from an approximation, then the maximum absolute error is called the maximum likelihood estimation of the value of s. Approximations generated with the minimax norm from the non-adaptive program [1] will minimize the maximum likelihood estimate of s. Unfortunately, errors in data are uniformly distributed only when all errors can be attributed to errors of computation (that is, the data is exact up to the last few bits), thus one can seldom use the minimax norm.
The most popular alternative is to assume that the errors have a normal distribution given by:
f(e;m,s) = exp(-(e-m)2/2s2)/((2p)1/2s)(recent research, however, does not uphold this assumption). Given the errors ei, i=1,2,...,n the maximum likelihood estimates of m and s are respectively the mean and standard deviation. If the mean is zero, then the standard deviation s is given by

This standard deviation can be minimized by approximation using the L2 or least squares norm approach from [1].
However, modern statistical research indicates that the best approximations are produced by assuming that errors are described by the less frequently used Cauchy distribution, given by:
f(e;s) = s/(p(s2+e2))Statisticians call approximation driven by this assumption about errors "robust" estimation, because the estimates are not influenced by an occasional large error, or "outlier".
For this distribution, the maximum likelihood estimate s* of the parameter s, given the errors ei,i=1,2,...,n is

Which is a definition of the L1-norm, another approach supported in the earlier non-adaptive program [1].
Information Theory (The AIC)
The minimum amount of information which one can prescribe to a set of errors is the form of the distribution function. Thus, the user, having chosen a suitable set of approximation functions, decides which distribution function to expect from the actual errors. An adaptive algorithm needs only the form of the distribution and not the distribution parameters; these parameters become an integral part of the output for subsequent analysis.To select the distribution form, we need some way to compare the errors of a single approximation with the unknown, underlying errors of the data. The 'Mean Information for Discrimination', an information theoretic concept related to the 'Maximum Entropy Principle', forms the basis for such a comparison.
Using these concepts, theoreticians have shown that
-2 � ln f(ei;s*) + 2k(where f(e;s) is a selected distribution function, s* is the maximum likelihood estimate of the distribution parameters given the n errors (observations) ei, and k is the number of unknown parameters.) Thus, by the maximum entropy principle, we seek a value of k and a set of errors ei that minimizes this expression.
This information theoretic criterion was first used in the analysis of time series and is known in the statistics literature as the AIC. If you assume that the errors are normally distributed, then this method is equivalent to the method known as 'Generalized Cross Validation'. The method described here is superior because it relaxes the restrictive assumption about normally distributed data errors. The mathematically inclined reader can find all the relevant proofs in [2].
For each of the distributions considered above, we get the AIC from the maximum likelihood estimates of the parameters. Thus:
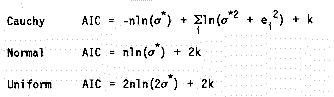
The goal of the algorithm is to minimize the appropriate AIC with respect to k.
Optimization
To optimize the knot positions for each value of k, the algorithm must determine the best position for the knots by optimizing the AIC function. This is a highly non-linear function of these knot positions, which are constrained to lie within the bounds of the knots. In other words, we have a constrained non-linear optimization problem, which is at best a difficult computational problem. The problem becomes more tractable if we get rid of the constraints and transform the problem to an unconstrained one as follows.Given the knots Xo,...,X k define
hi = Xi - Xi-1and
si = ln(hi+1/hi)This gives k-1 unconstrained variables and an unconstrained non-linear minimization problem. I strongly suggest you use a Quasi-Newton algorithm to solve this optimization problem. Also, make sure that the computer program that performs the optimization uses a rank-one update to keep the matrices symmetric positive definite, otherwise convergence is most unlikely.
Algorithm
The flow chart in Figure 1 describes a general algorithm, useful for any fitting function.
Figure 1
In this flow chart the knots represent unknown parameters. For a time series adaptive fit, the knots are the new periods. For piecewise polynomial fits, the knots are the points where the pieces fit together. As the flow chart shows, the algorithm converges when the value of the AIC stops decreasing. In each of the AIC functions, the first part is strictly decreasing, while the second part is strictly increasing. The minimum occurs when the increasing part, which begins at zero, takes over the decreasing part.The program in Listing 1 utilizes the piecewise cubic approximation described in my earlier non-adaptive solution [1] to create an adaptive solution to the data fitting problem.
Listing 1
The main routine adapt( ) follows the algorithm using the approximation routine Hermite( ) from [1]. First we fit the data to two, then three knots to give the first values of AIC for comparison. If a minimum AIC is not found, we consider each interval to see if it is a candidate for the inclusion of an extra knot.This step involves some heuristic reasoning. We say that an interval is a candidate for a new knot if the second moment of the errors in that interval is larger than the global second moment. If the interval is a candidate for a new knot, then we find the best position for the knot using the routine point( ). If the new point is close to an old knot, we exchange the knots and do not add another. If, on the other hand, the new point is not close to an old knot, then we add the new point as a new knot. This testing (to see whether the new point is close to a knot or not) is performed in the routine test_point( ).
The routine AIC( ) computes the value of the AIC for different distributions. The utility routine numpoints( ) computes the number of data points in a given interval. After the final fit is achieved, we then optimize the position of the knots using the routine QN_BFGS_F( ), which is a Quasi-Newton algorithm using a Broyden, Fletcher, Golfarb, Shanno formula. This algorithm is numerically stable if rank-one updates of the Cholesky factors are implemented.
Figure 2 and Figure 3 show the results of a demonstration run in which some error was added to 200 points generated by the function x2/3.
Figure 2 shows the result of the program run with this data with a normal distribution assumption. Figure 3 shows the result when some spurious points from a straight line are added. A Cauchy distribution was assumed for this run so that the "outliers" would not influence the result.
Additionally, the knots and their positions in the figures from [1] were found using the program listed here.
Bibliography
1. Brannigan, M. "Fitting Curves to Data," The C Users Journal, January 1990.2. Brannigan, M. "A Multivariate Adaptive Data Fitting Algorithm" in Numerische Methoden der Approximation Theorie, vol. 5, ISNM Birkhauser 1982.
3. Akaike, H. "Information Theory and the Extension of the Maximum Likelihood Principle," Proc. 2nd Symp. Inf. Th. Akademie Kiado, Budapest 1973.